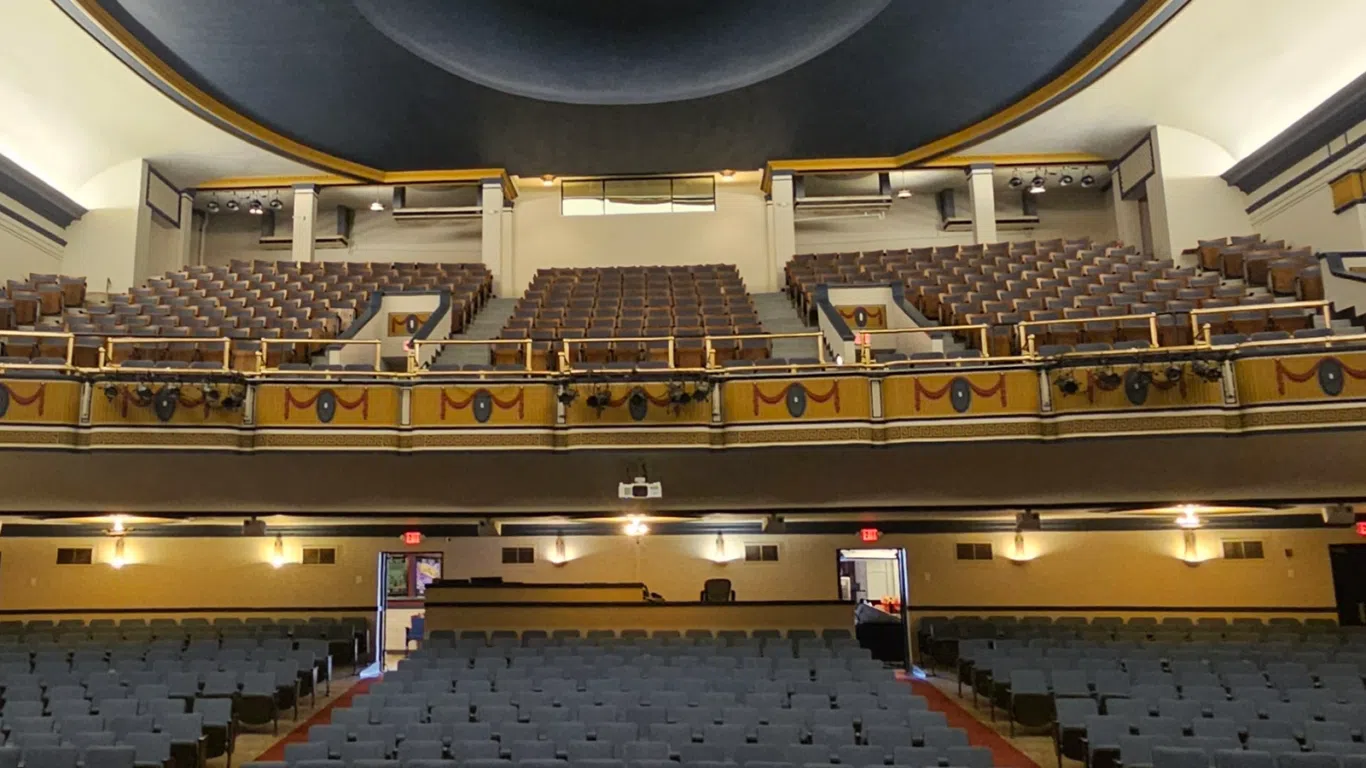
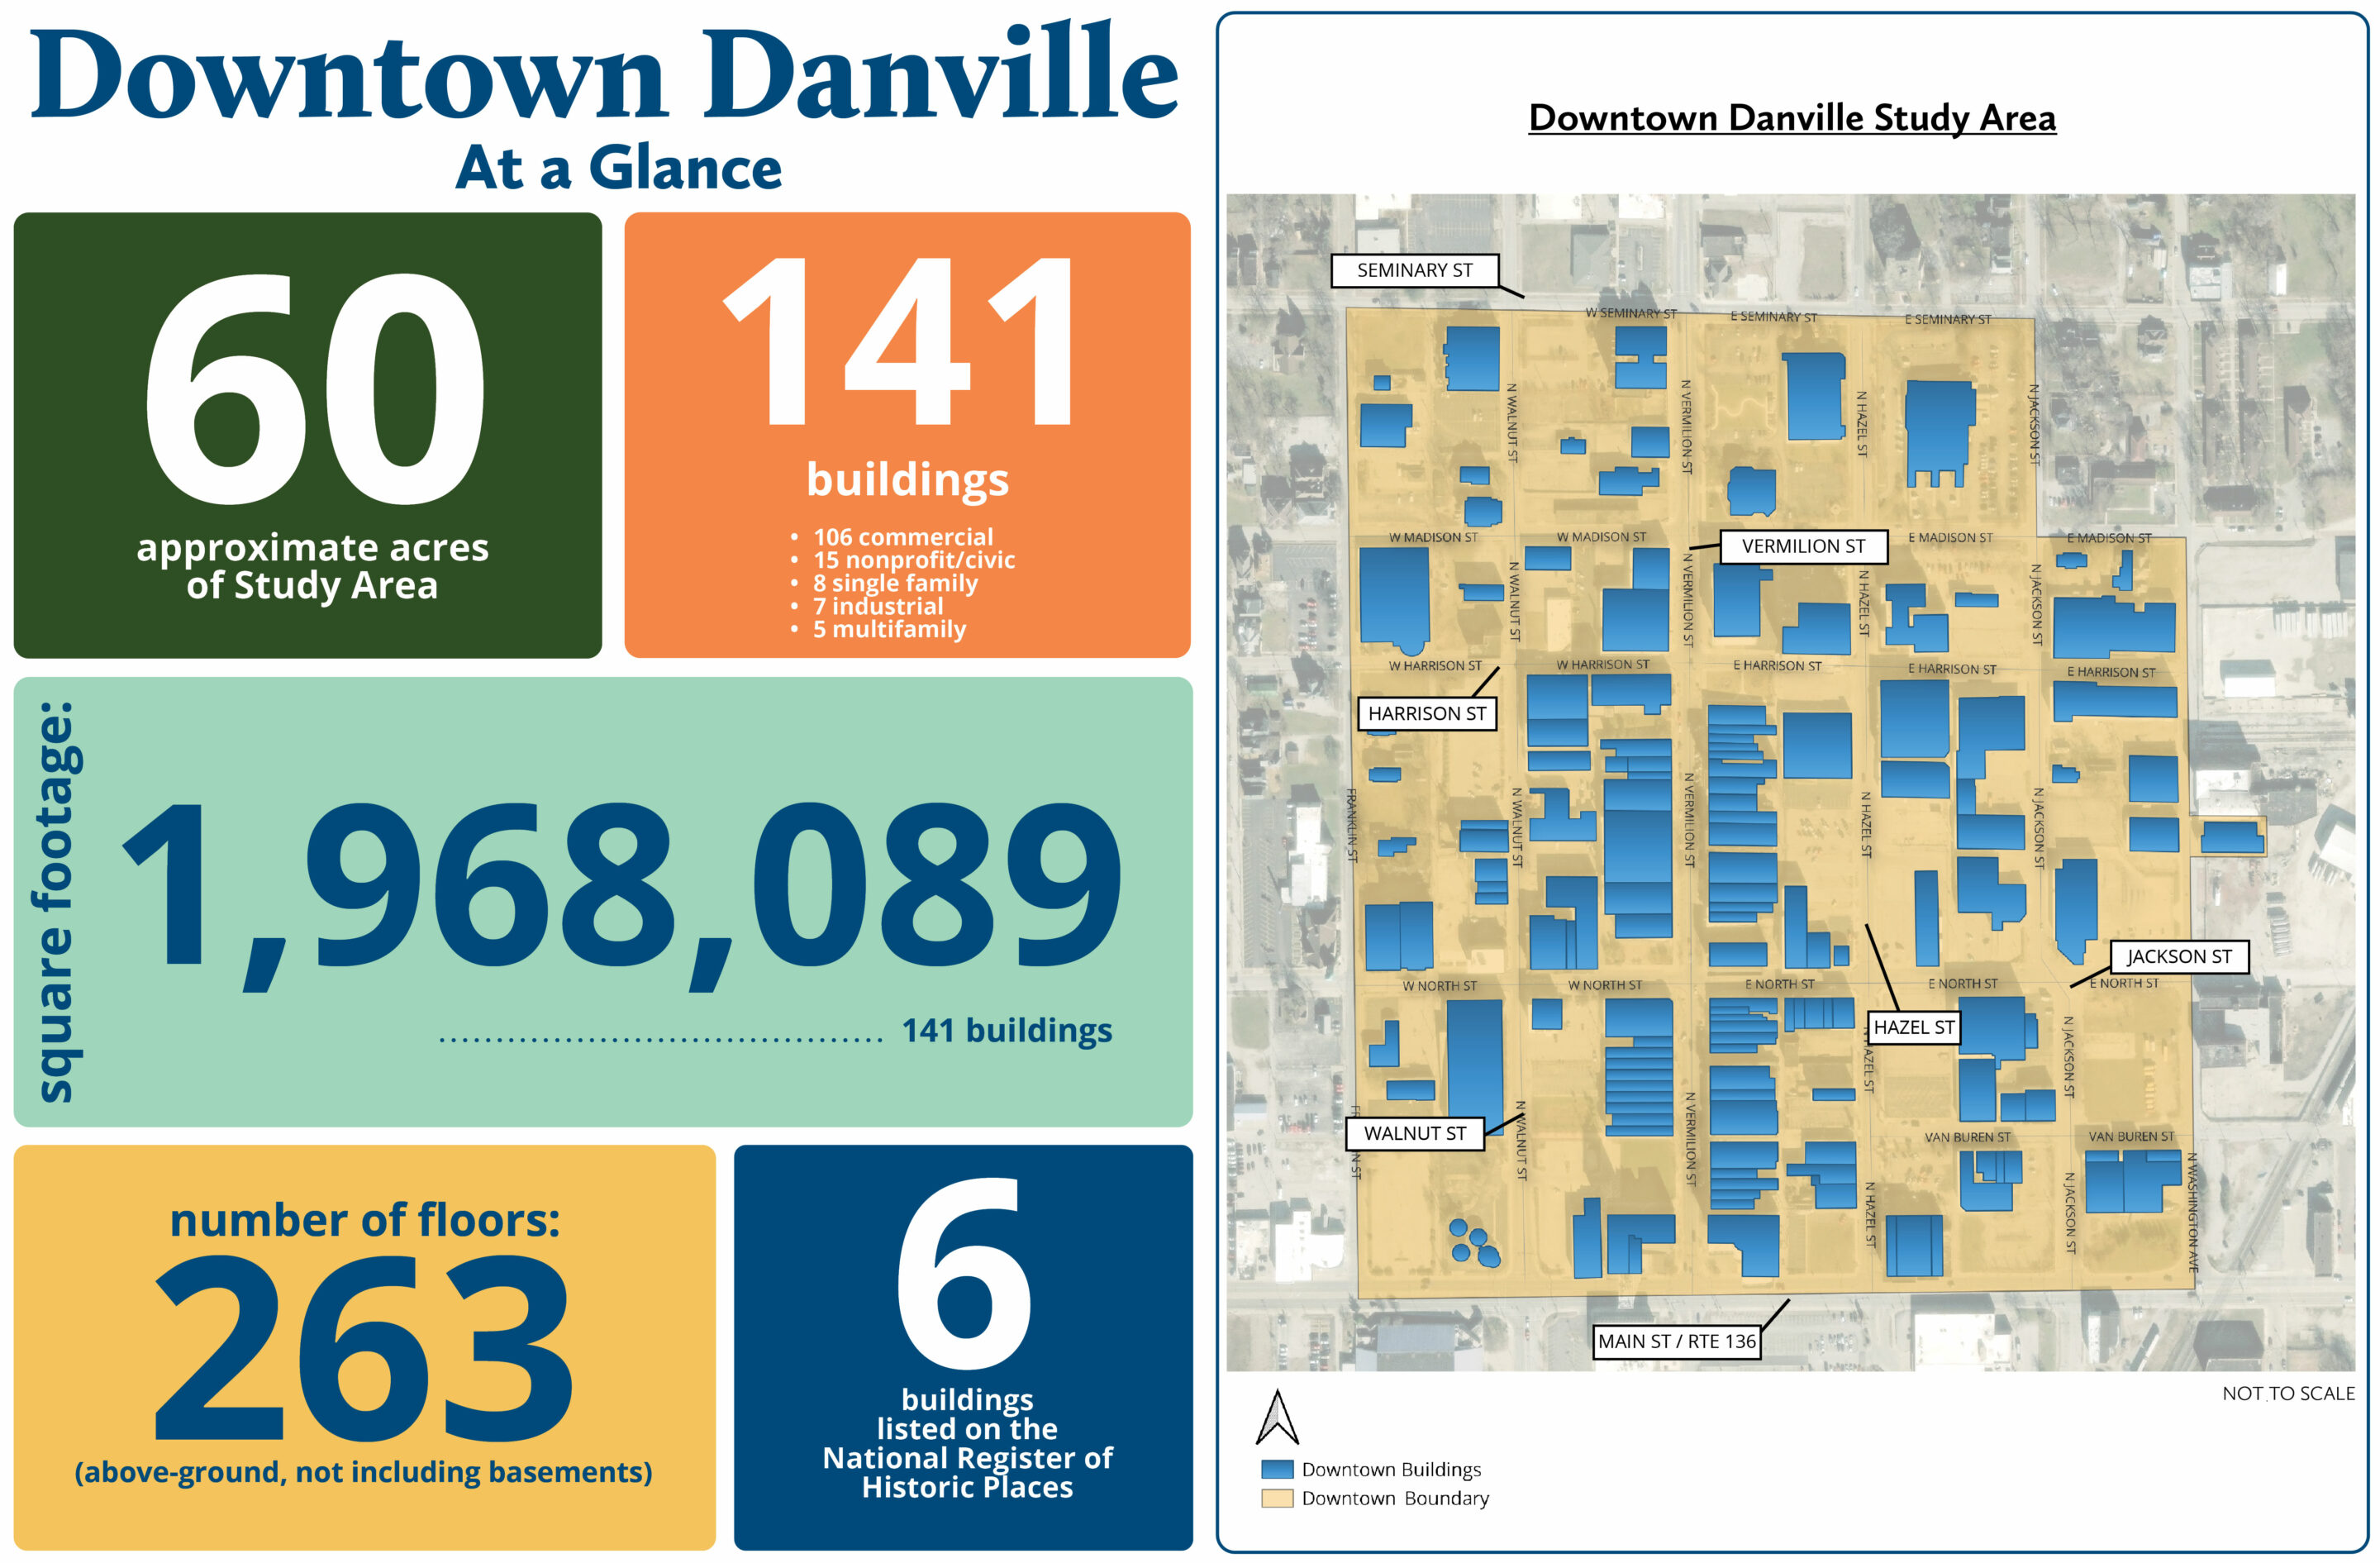
We recently put the finishing touches on the Downtown Danville Revitalization Plan and are eager to share it with, well, everyone! The plan is all about economic resiliency and revitalization, giving them the framework to recover from the financial setbacks which occurred during the COVID-19 pandemic.
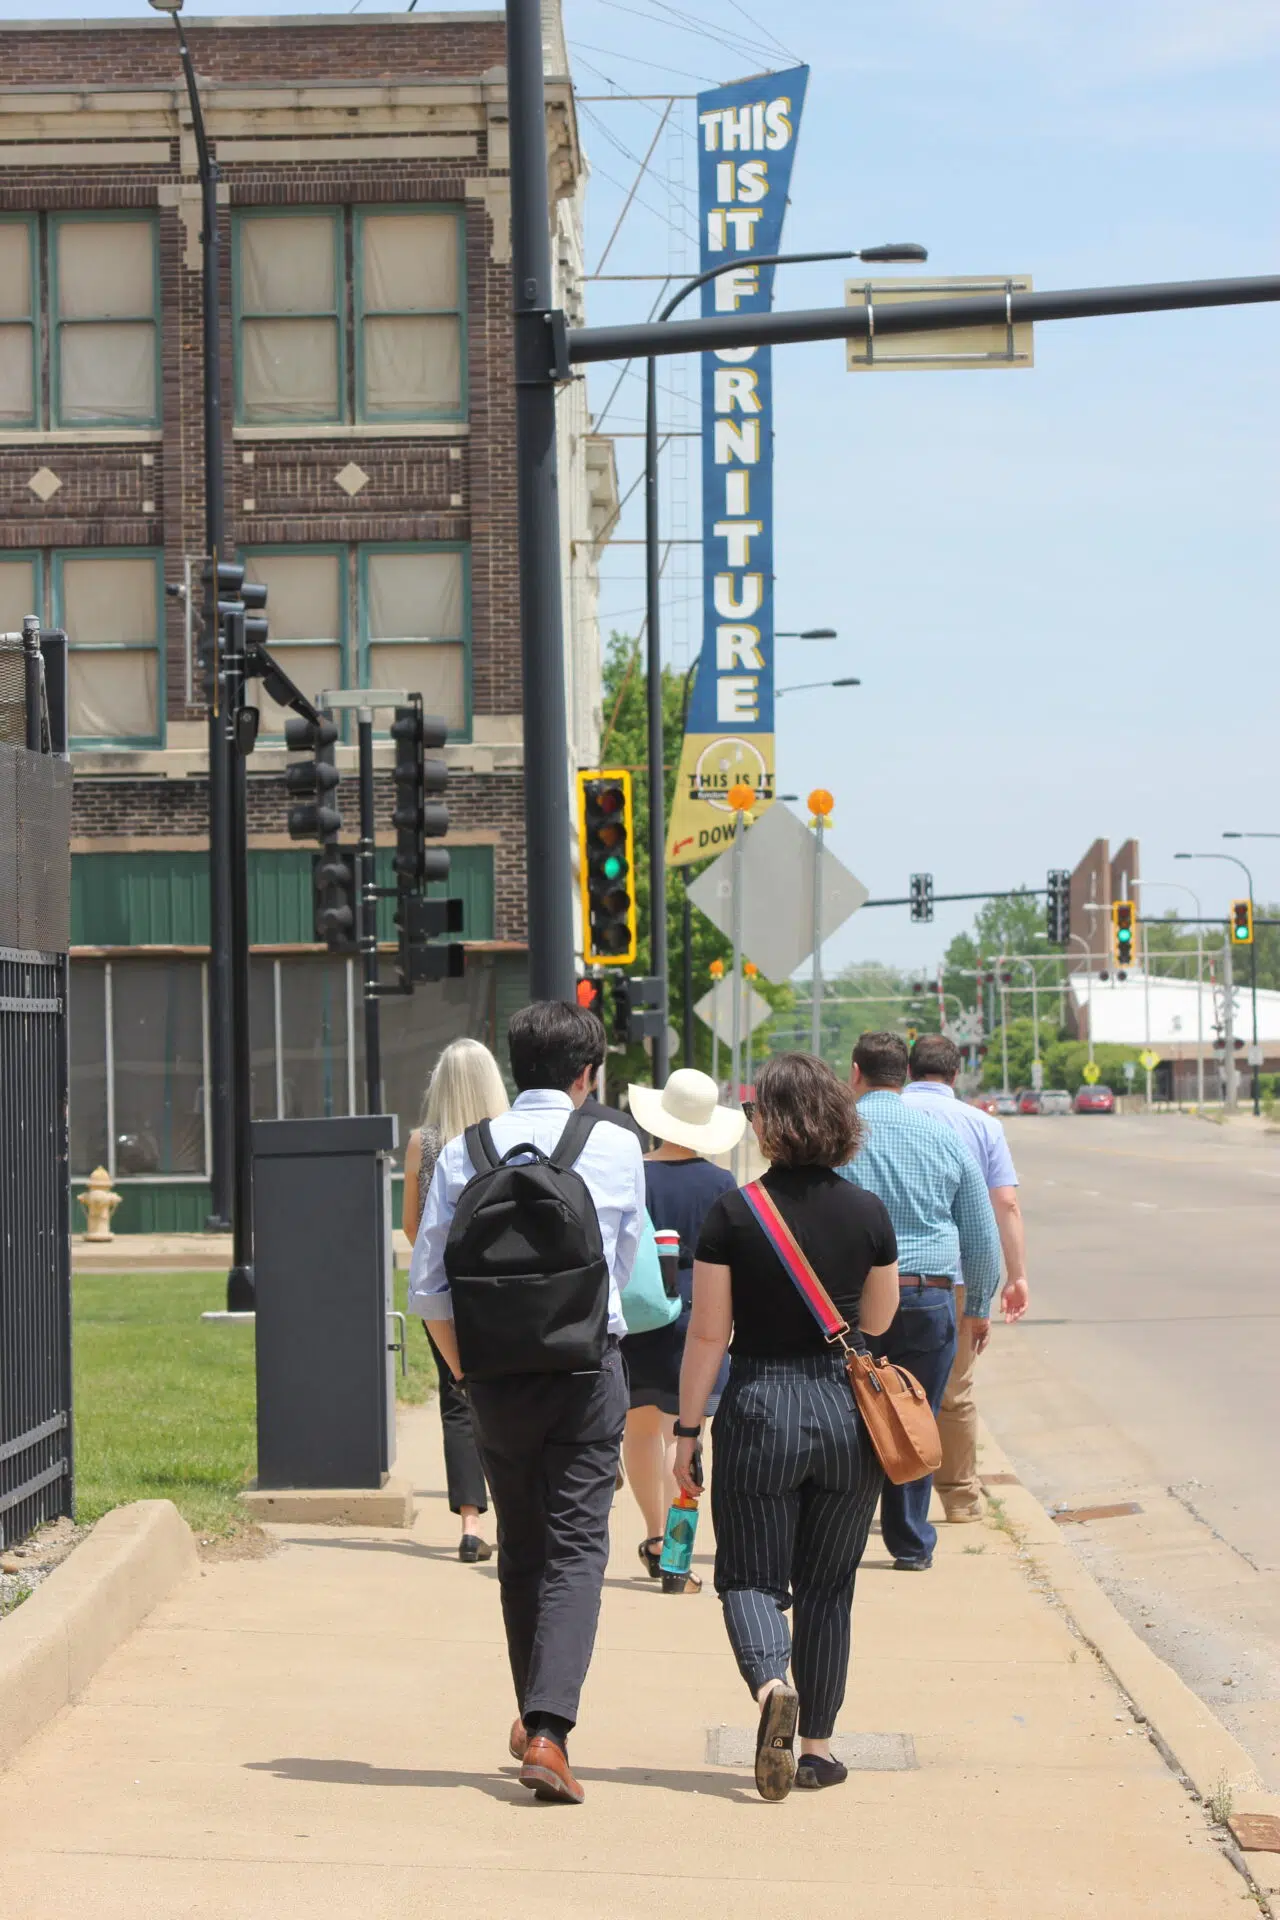
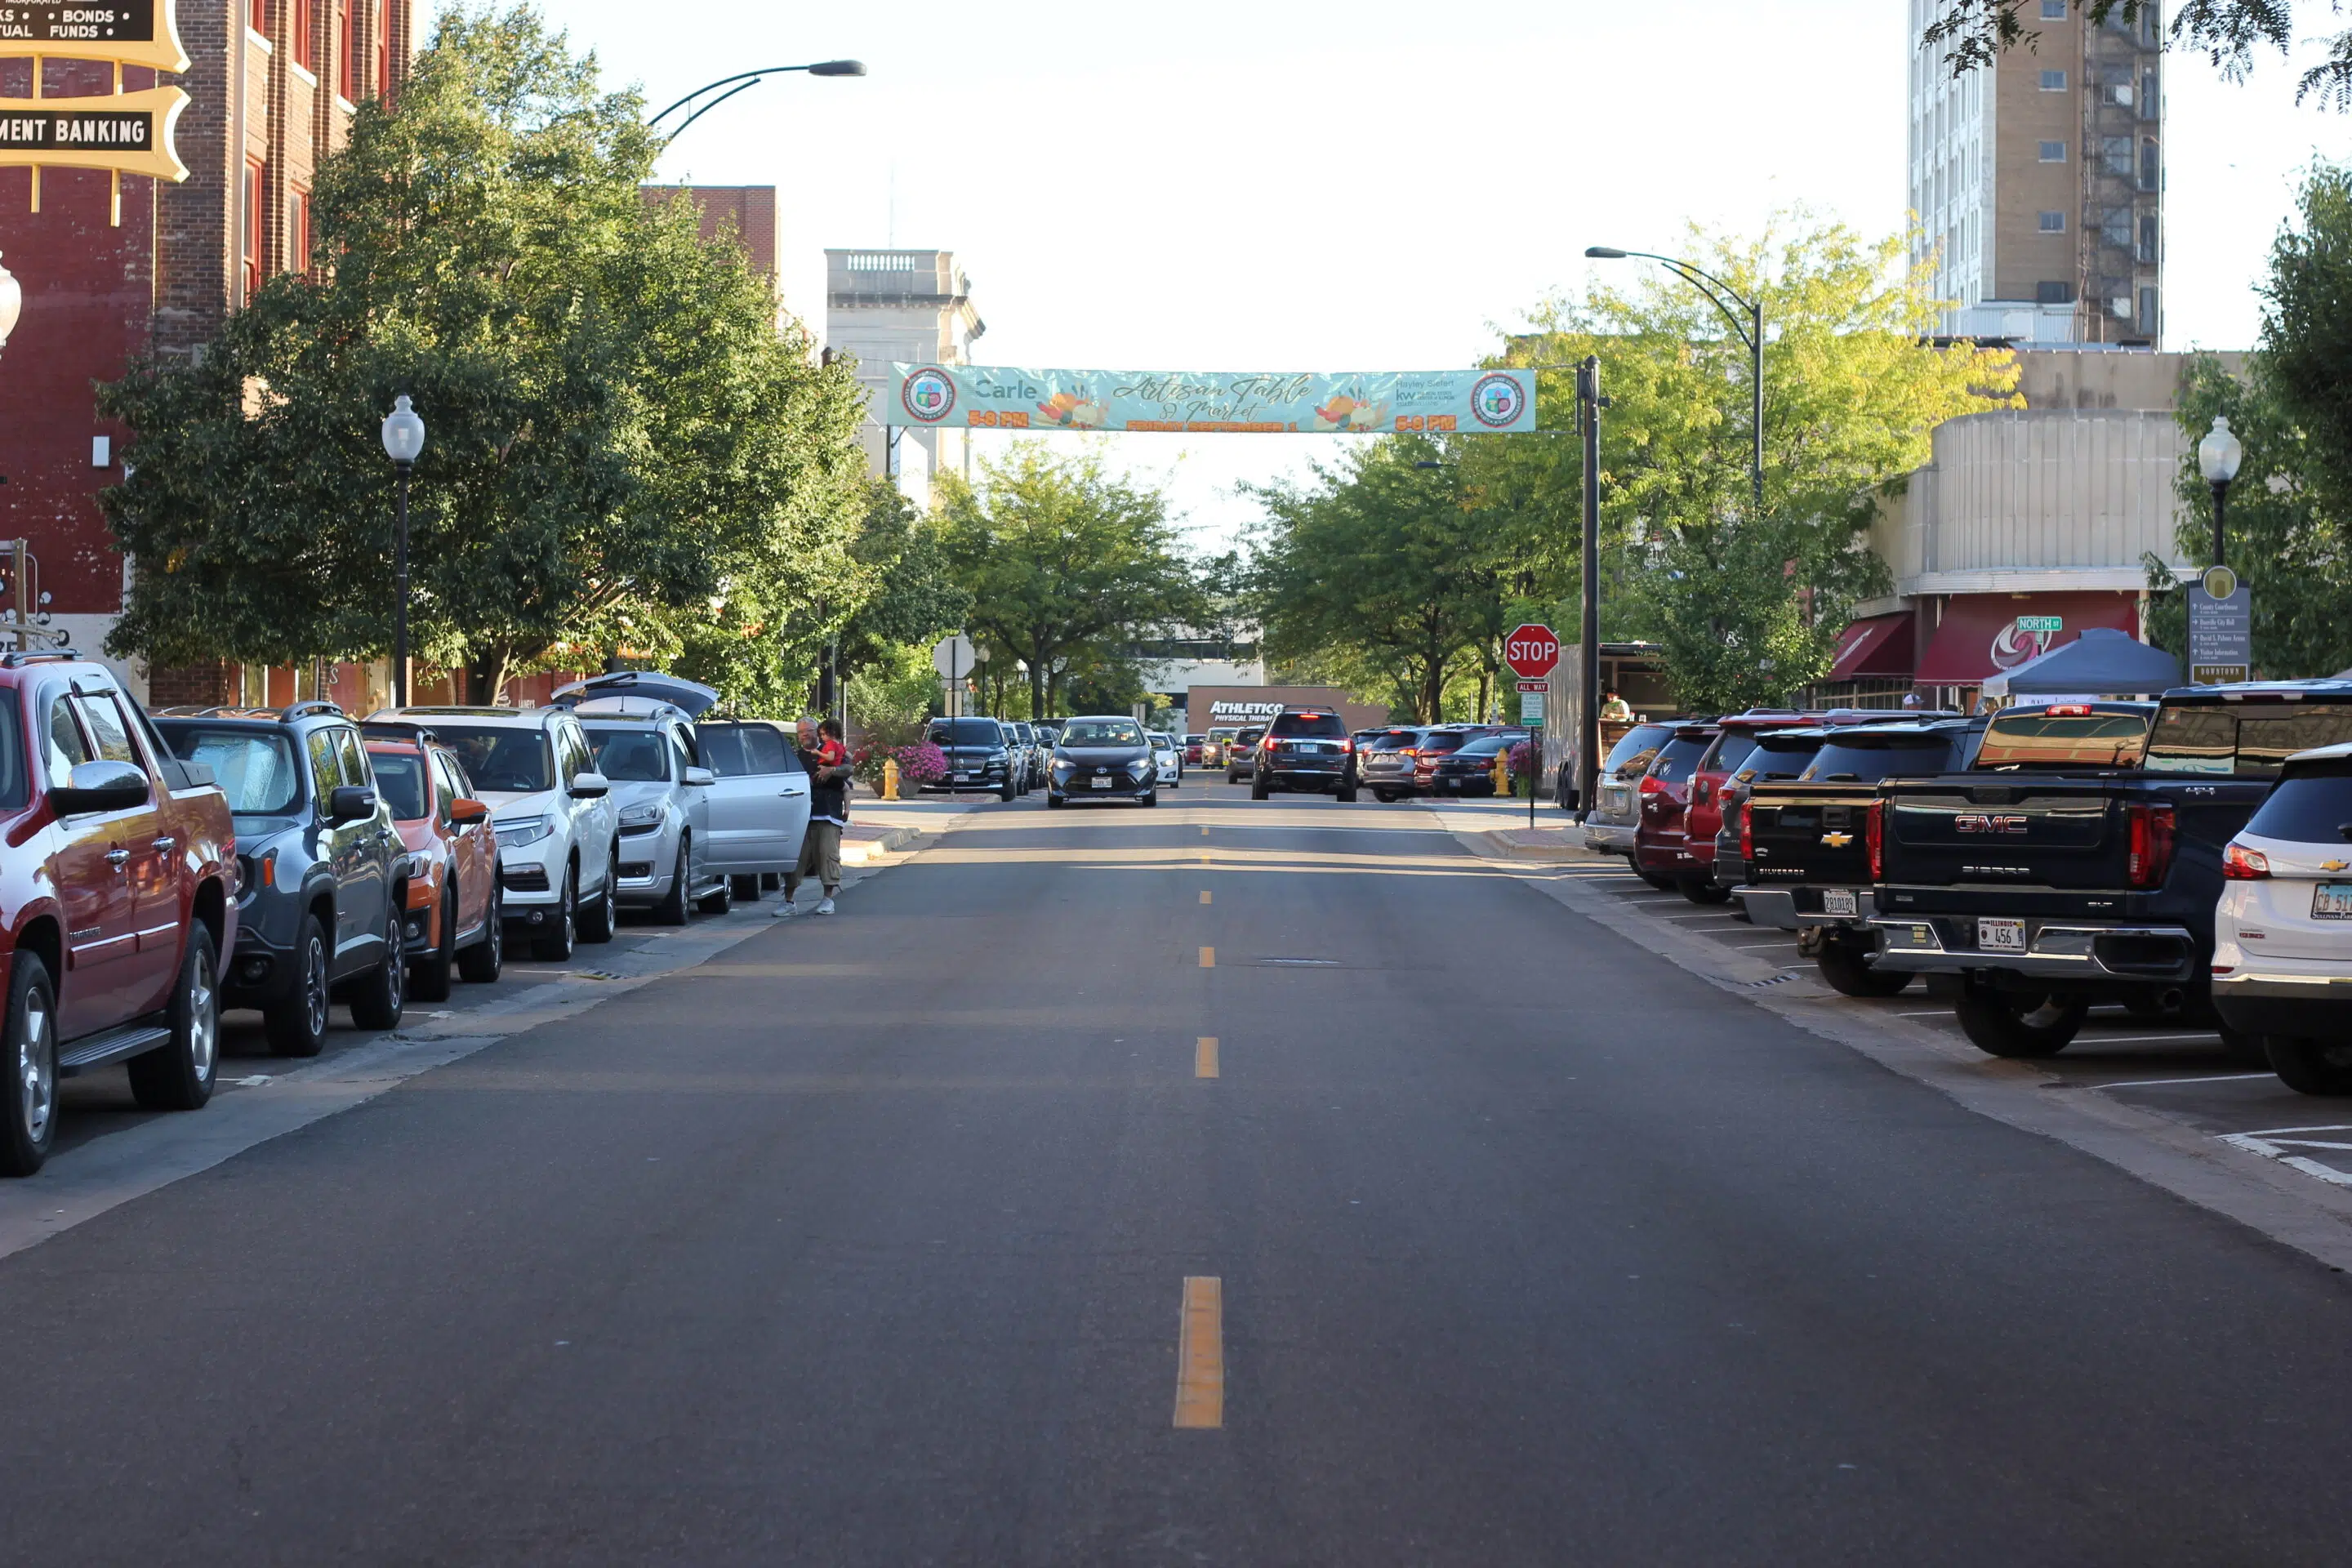
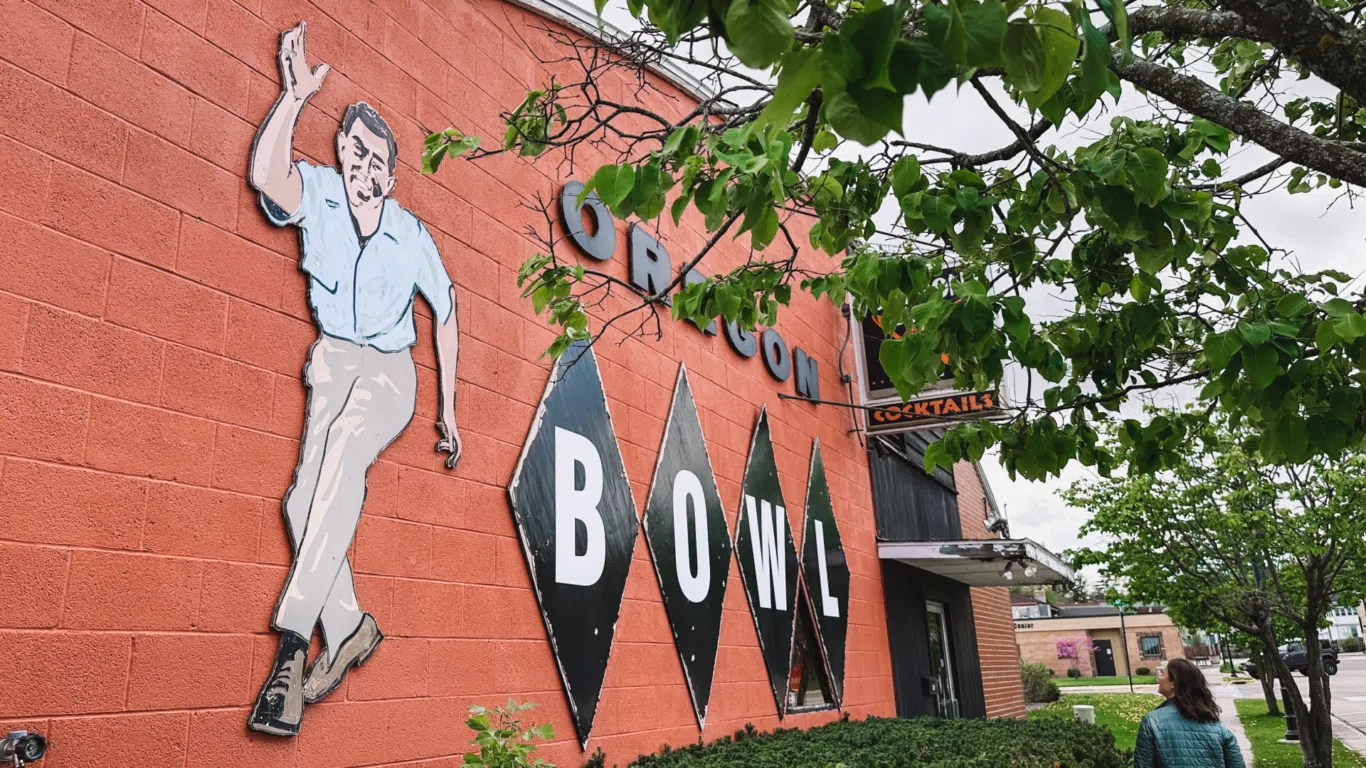
Danville was not immune from the effects of deindustrialization in the late 20th century, and many supportive businesses downtown closed as a result. We were told that there was “momentum” underway downtown, and that became abundantly clear during our first trip. Bit by bit, local entrepreneurs, city staff, and downtown advocates have been attracting visitors from throughout the region, one storefront and one event at a time.
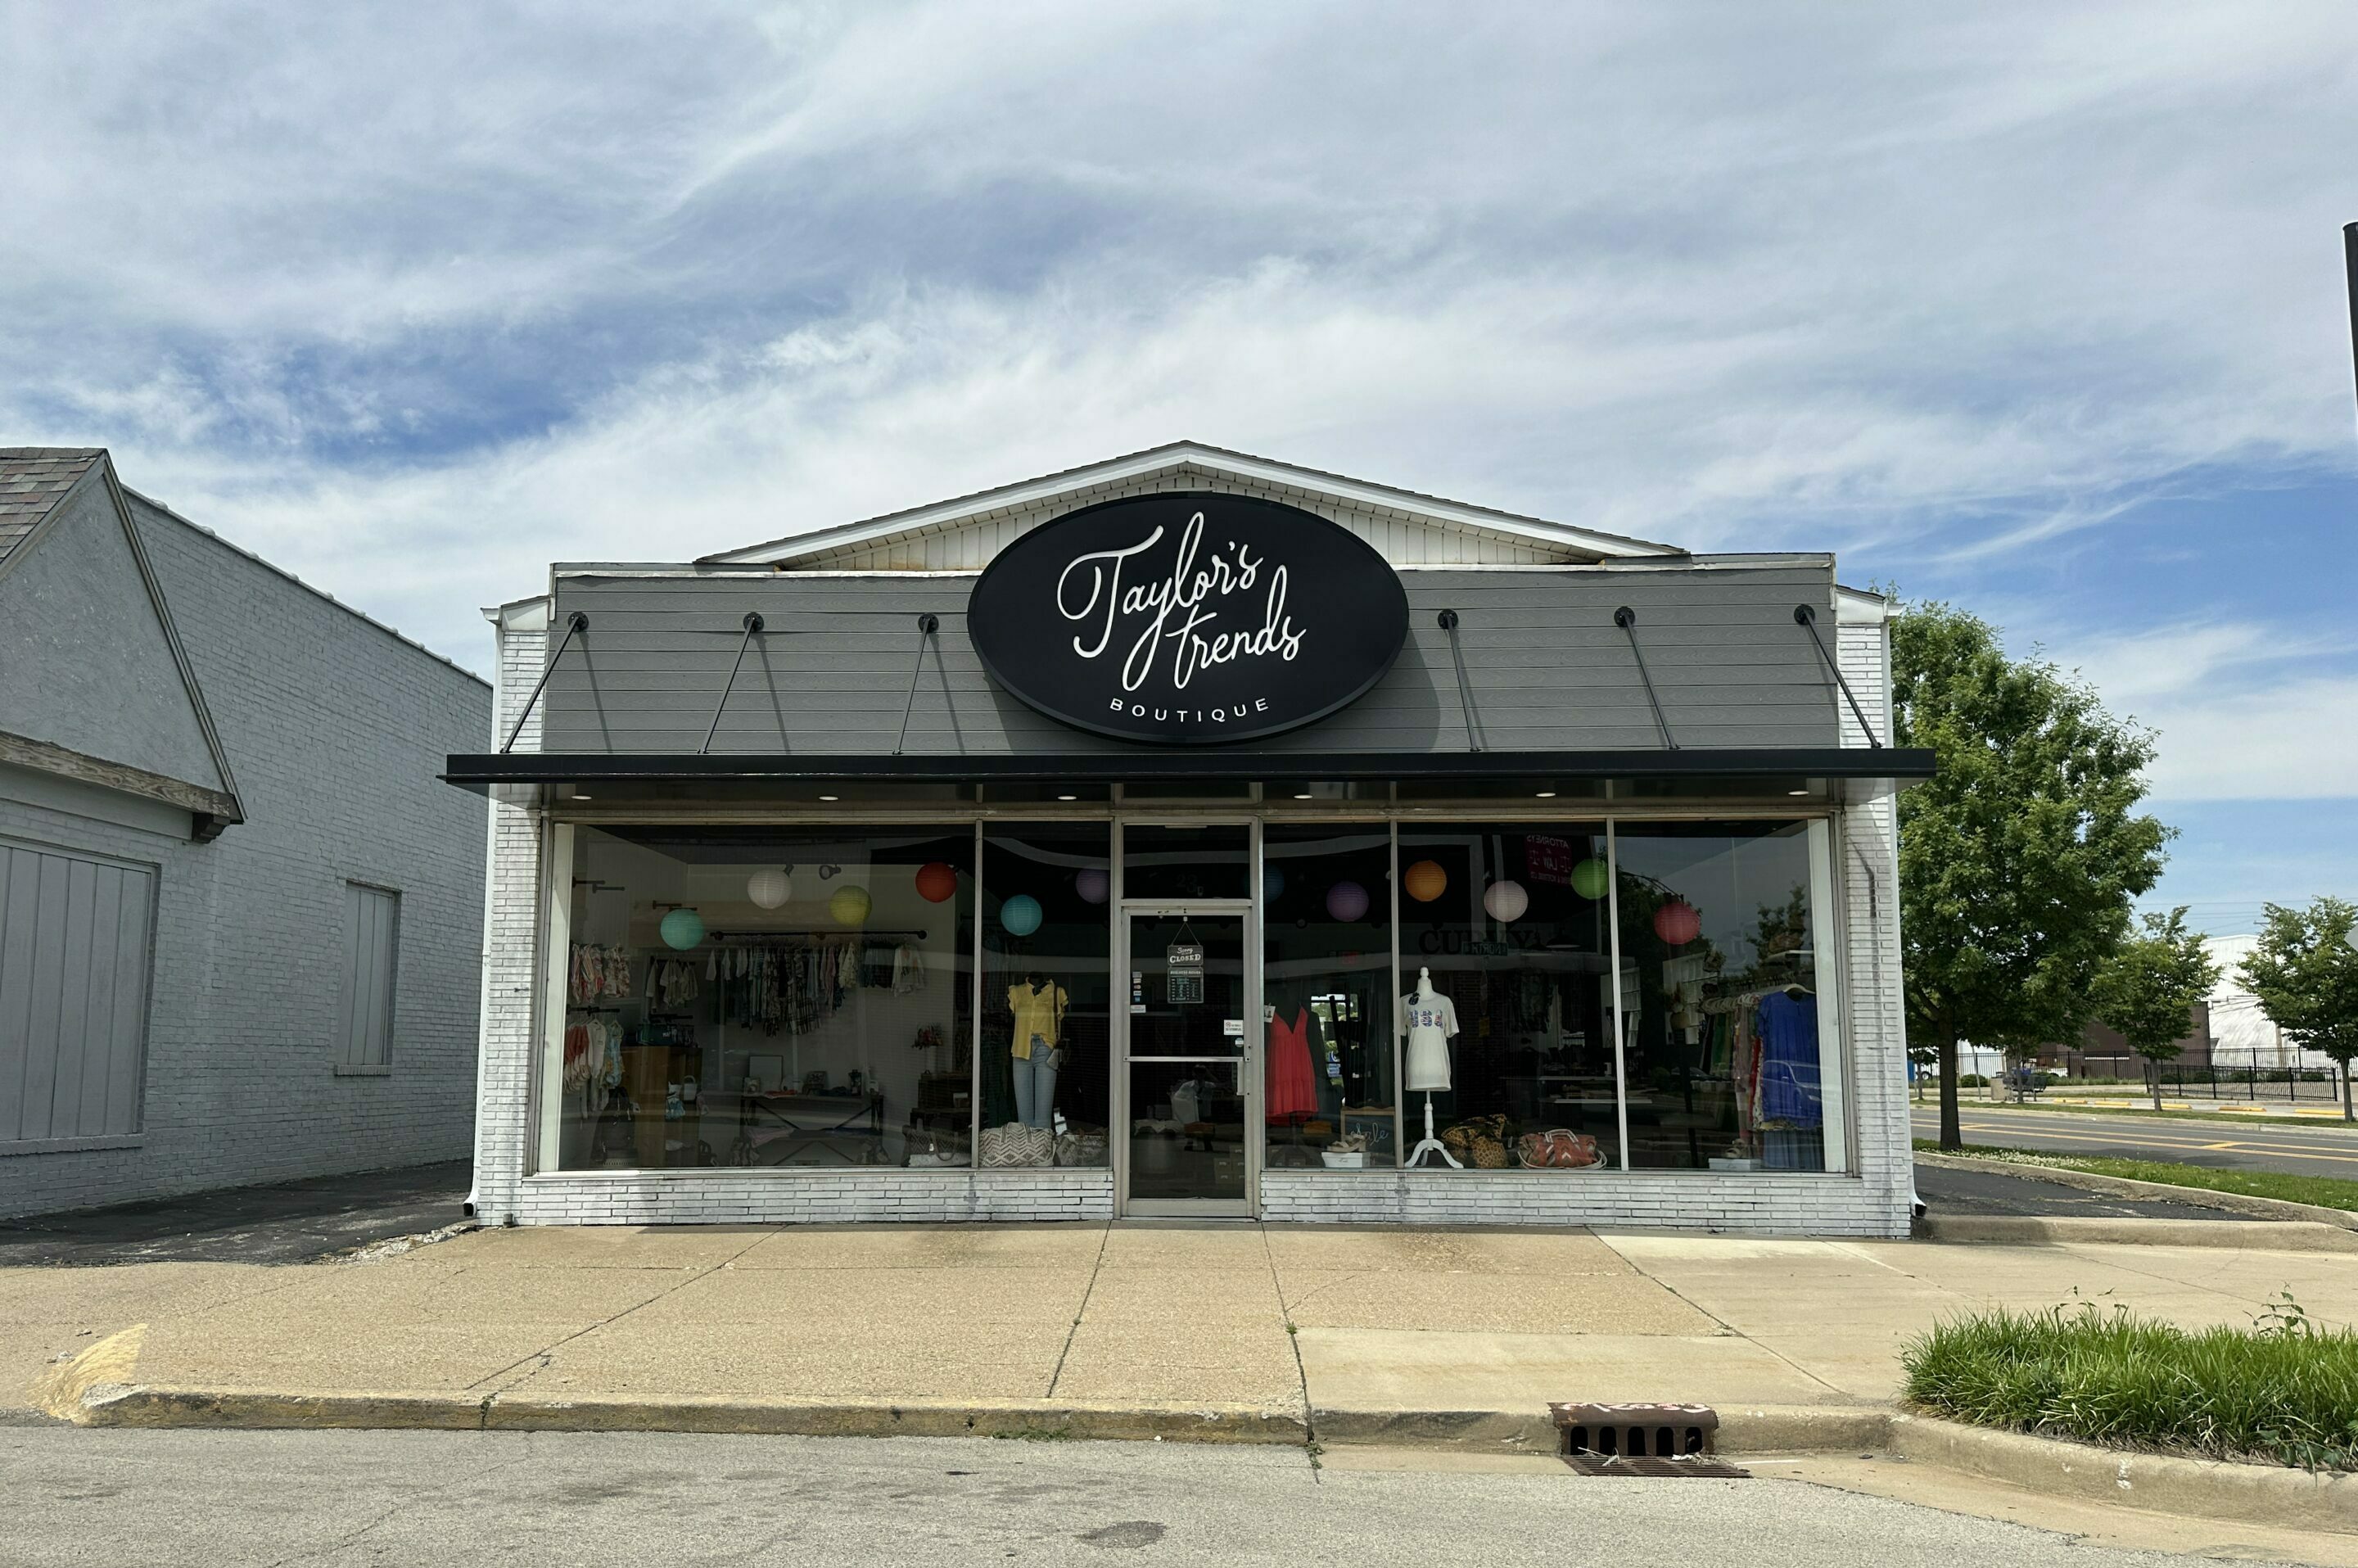
Taylor’s Trends is one of many locally-owned stores that has called downtown Danville home in recent years.
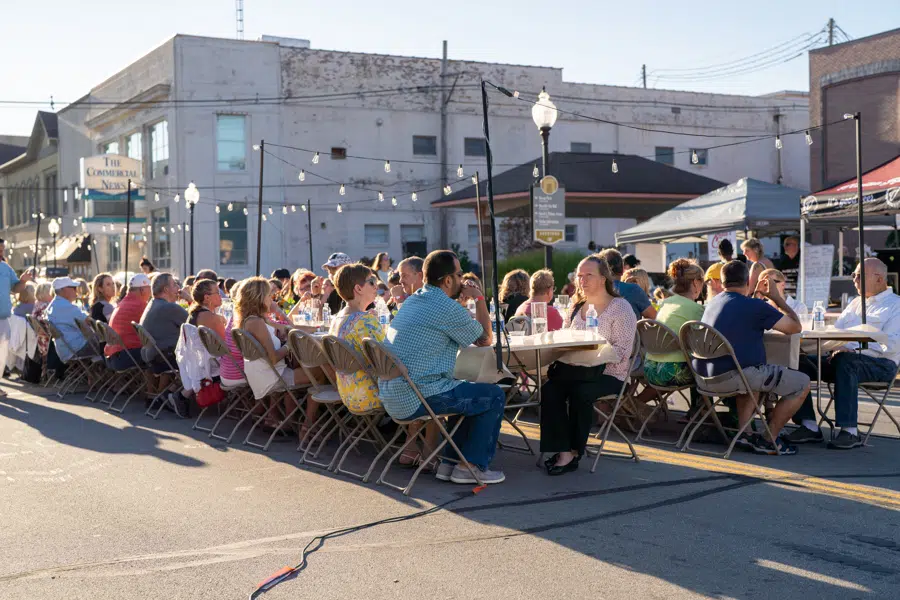
Danville First Fridays offer a variety of family-friendly activities that draw between 4,000-8,000 visitors each month. Image source: First Fridays in Downtown Danville
The Downtown Danville Revitalization Plan offers an in-depth look on redevelopment potential, visitor activity, placemaking, accessibility, and more. At 90 pages, it’ll take you a minute to read…so we thought we’d summarize the ‘Story of Danville’ in three maps.
Unlocking the Potential of Upper-Floor Residential Units
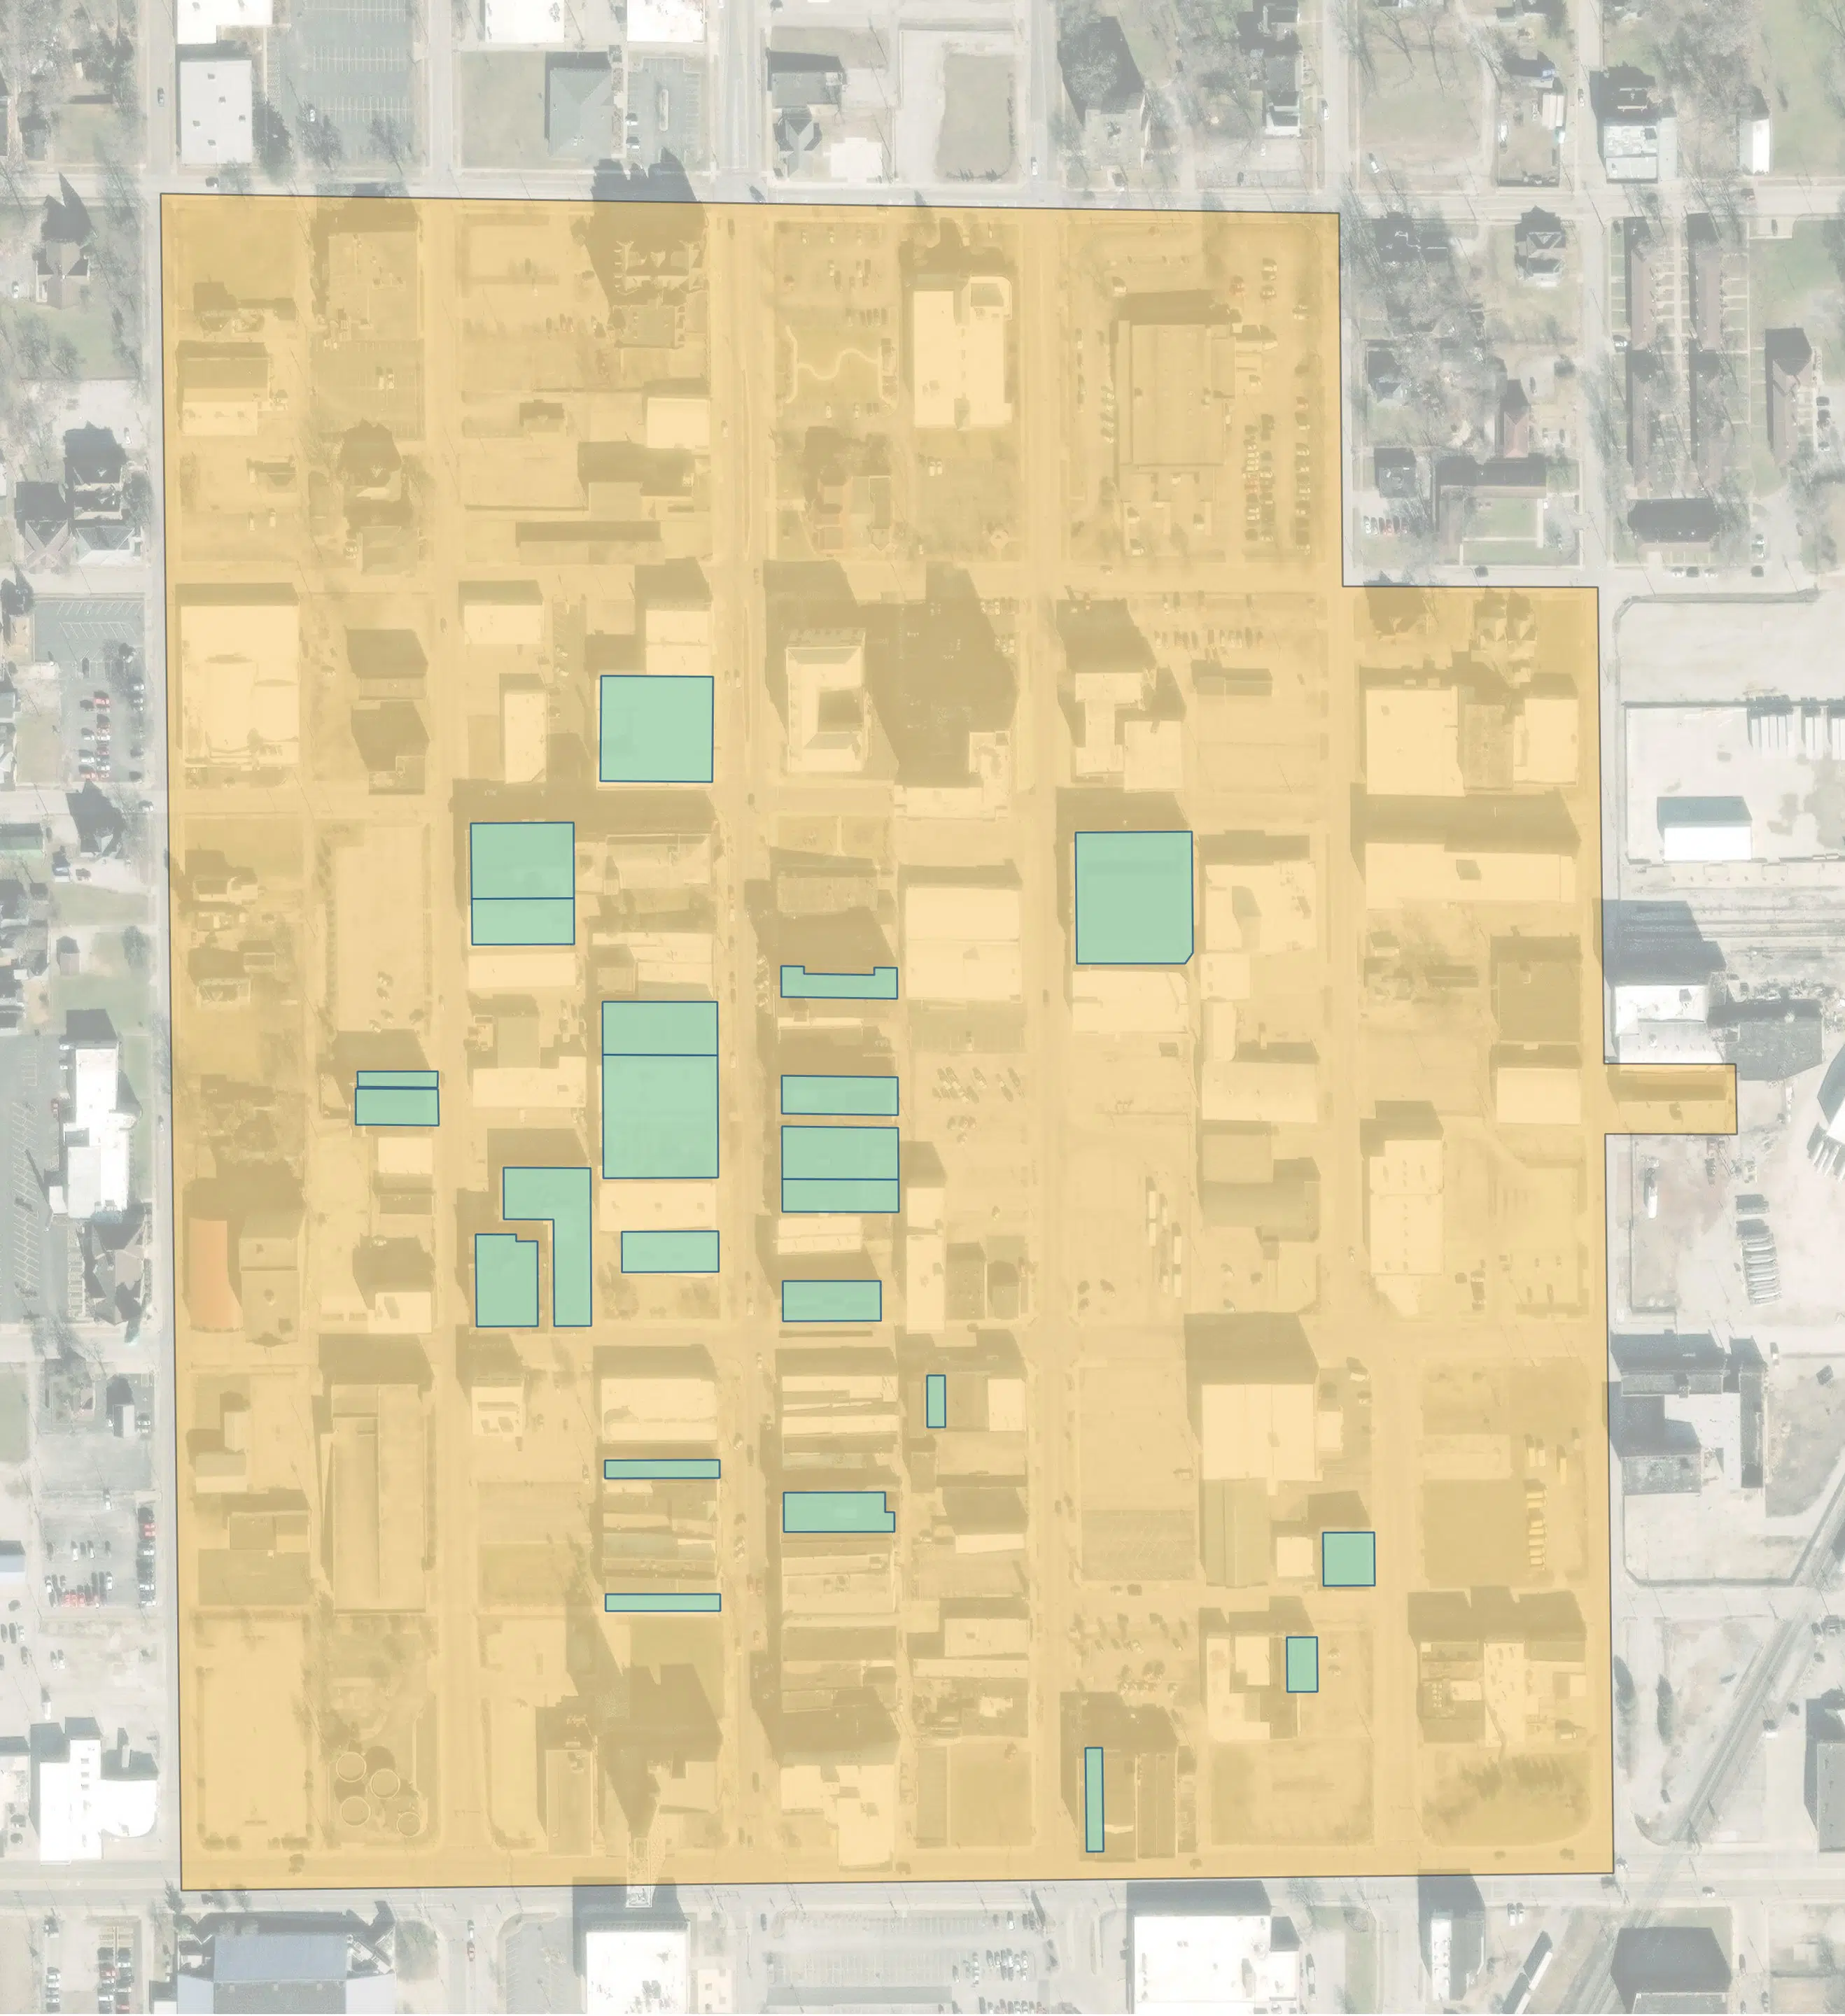
One of the central pieces of the plan is a Downtown Property Inventory. We compiled data on all 141 buildings in the study area on all sorts of topics: Building conditions, ownership and use, redevelopment potential, and more. This allowed us to illustrate property attributes in all sorts of ways. For example, the map below illustrates properties with upper floors that are suitable for residential use.
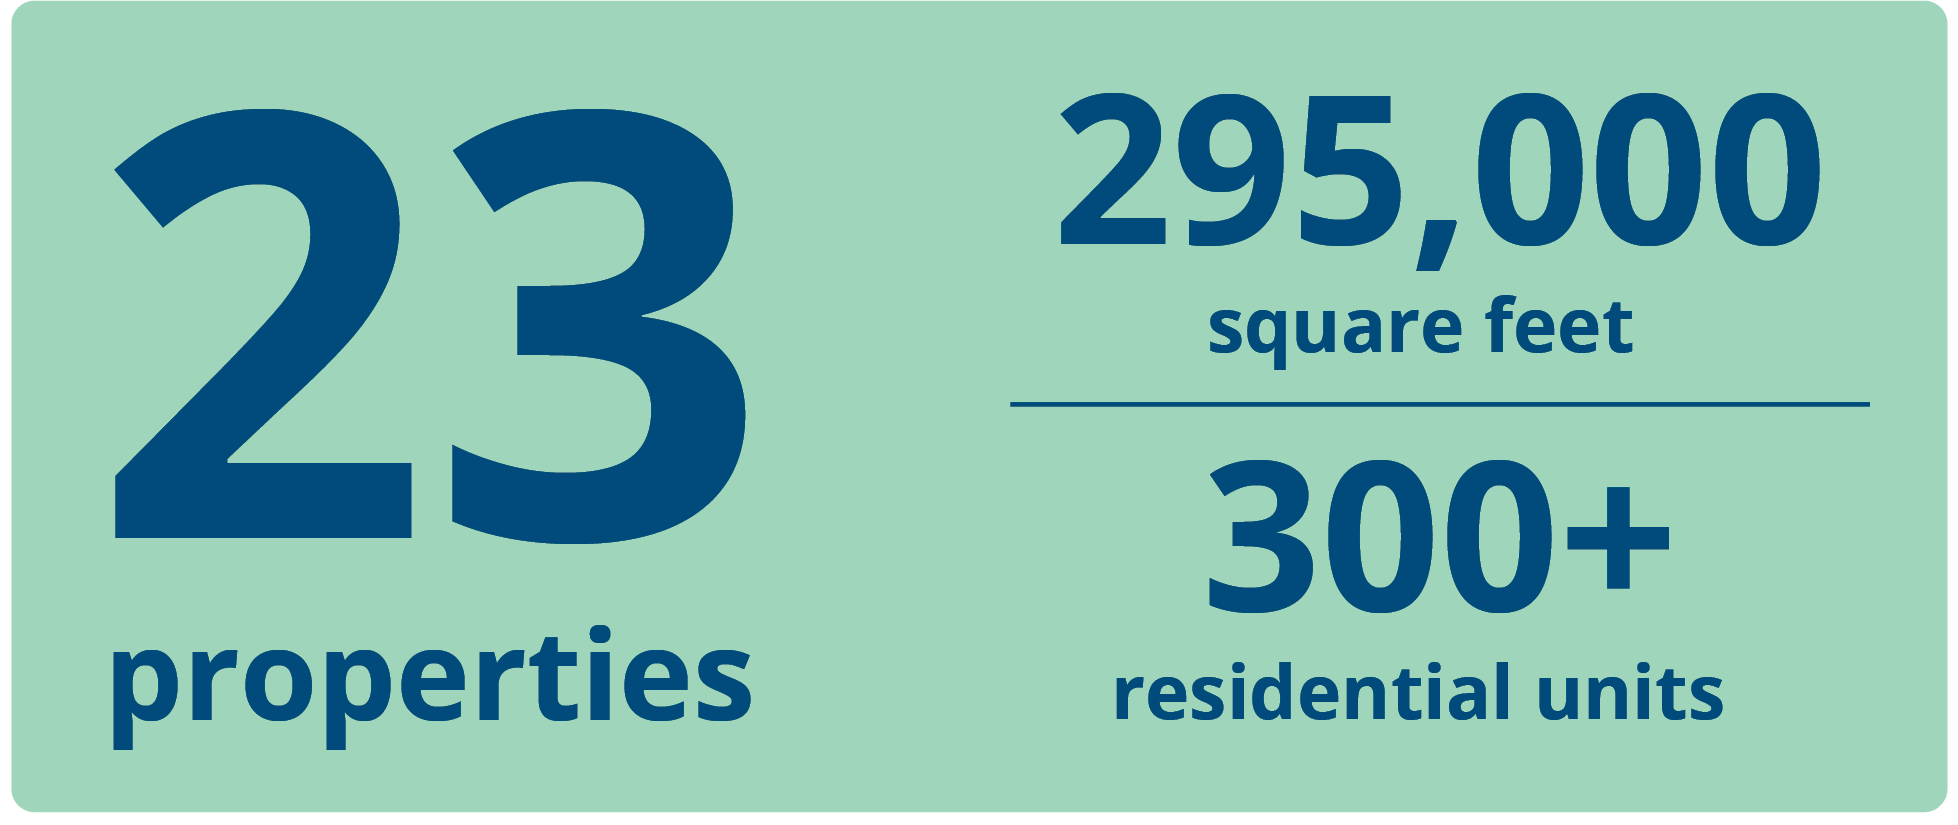
For this map, we reviewed two particular attributes. First, we analyzed properties that are suitable for residential uses (with variables such as accessibility, windows, etc.). Second, we reviewed properties whose upper floors are vacant or underutilized. This analysis resulted in a total of 23 properties with upper floors totaling 295,146 square feet, which could potentially accommodate 300+ residential units.
Identifying Contributing Buildings in a Proposed Historic District
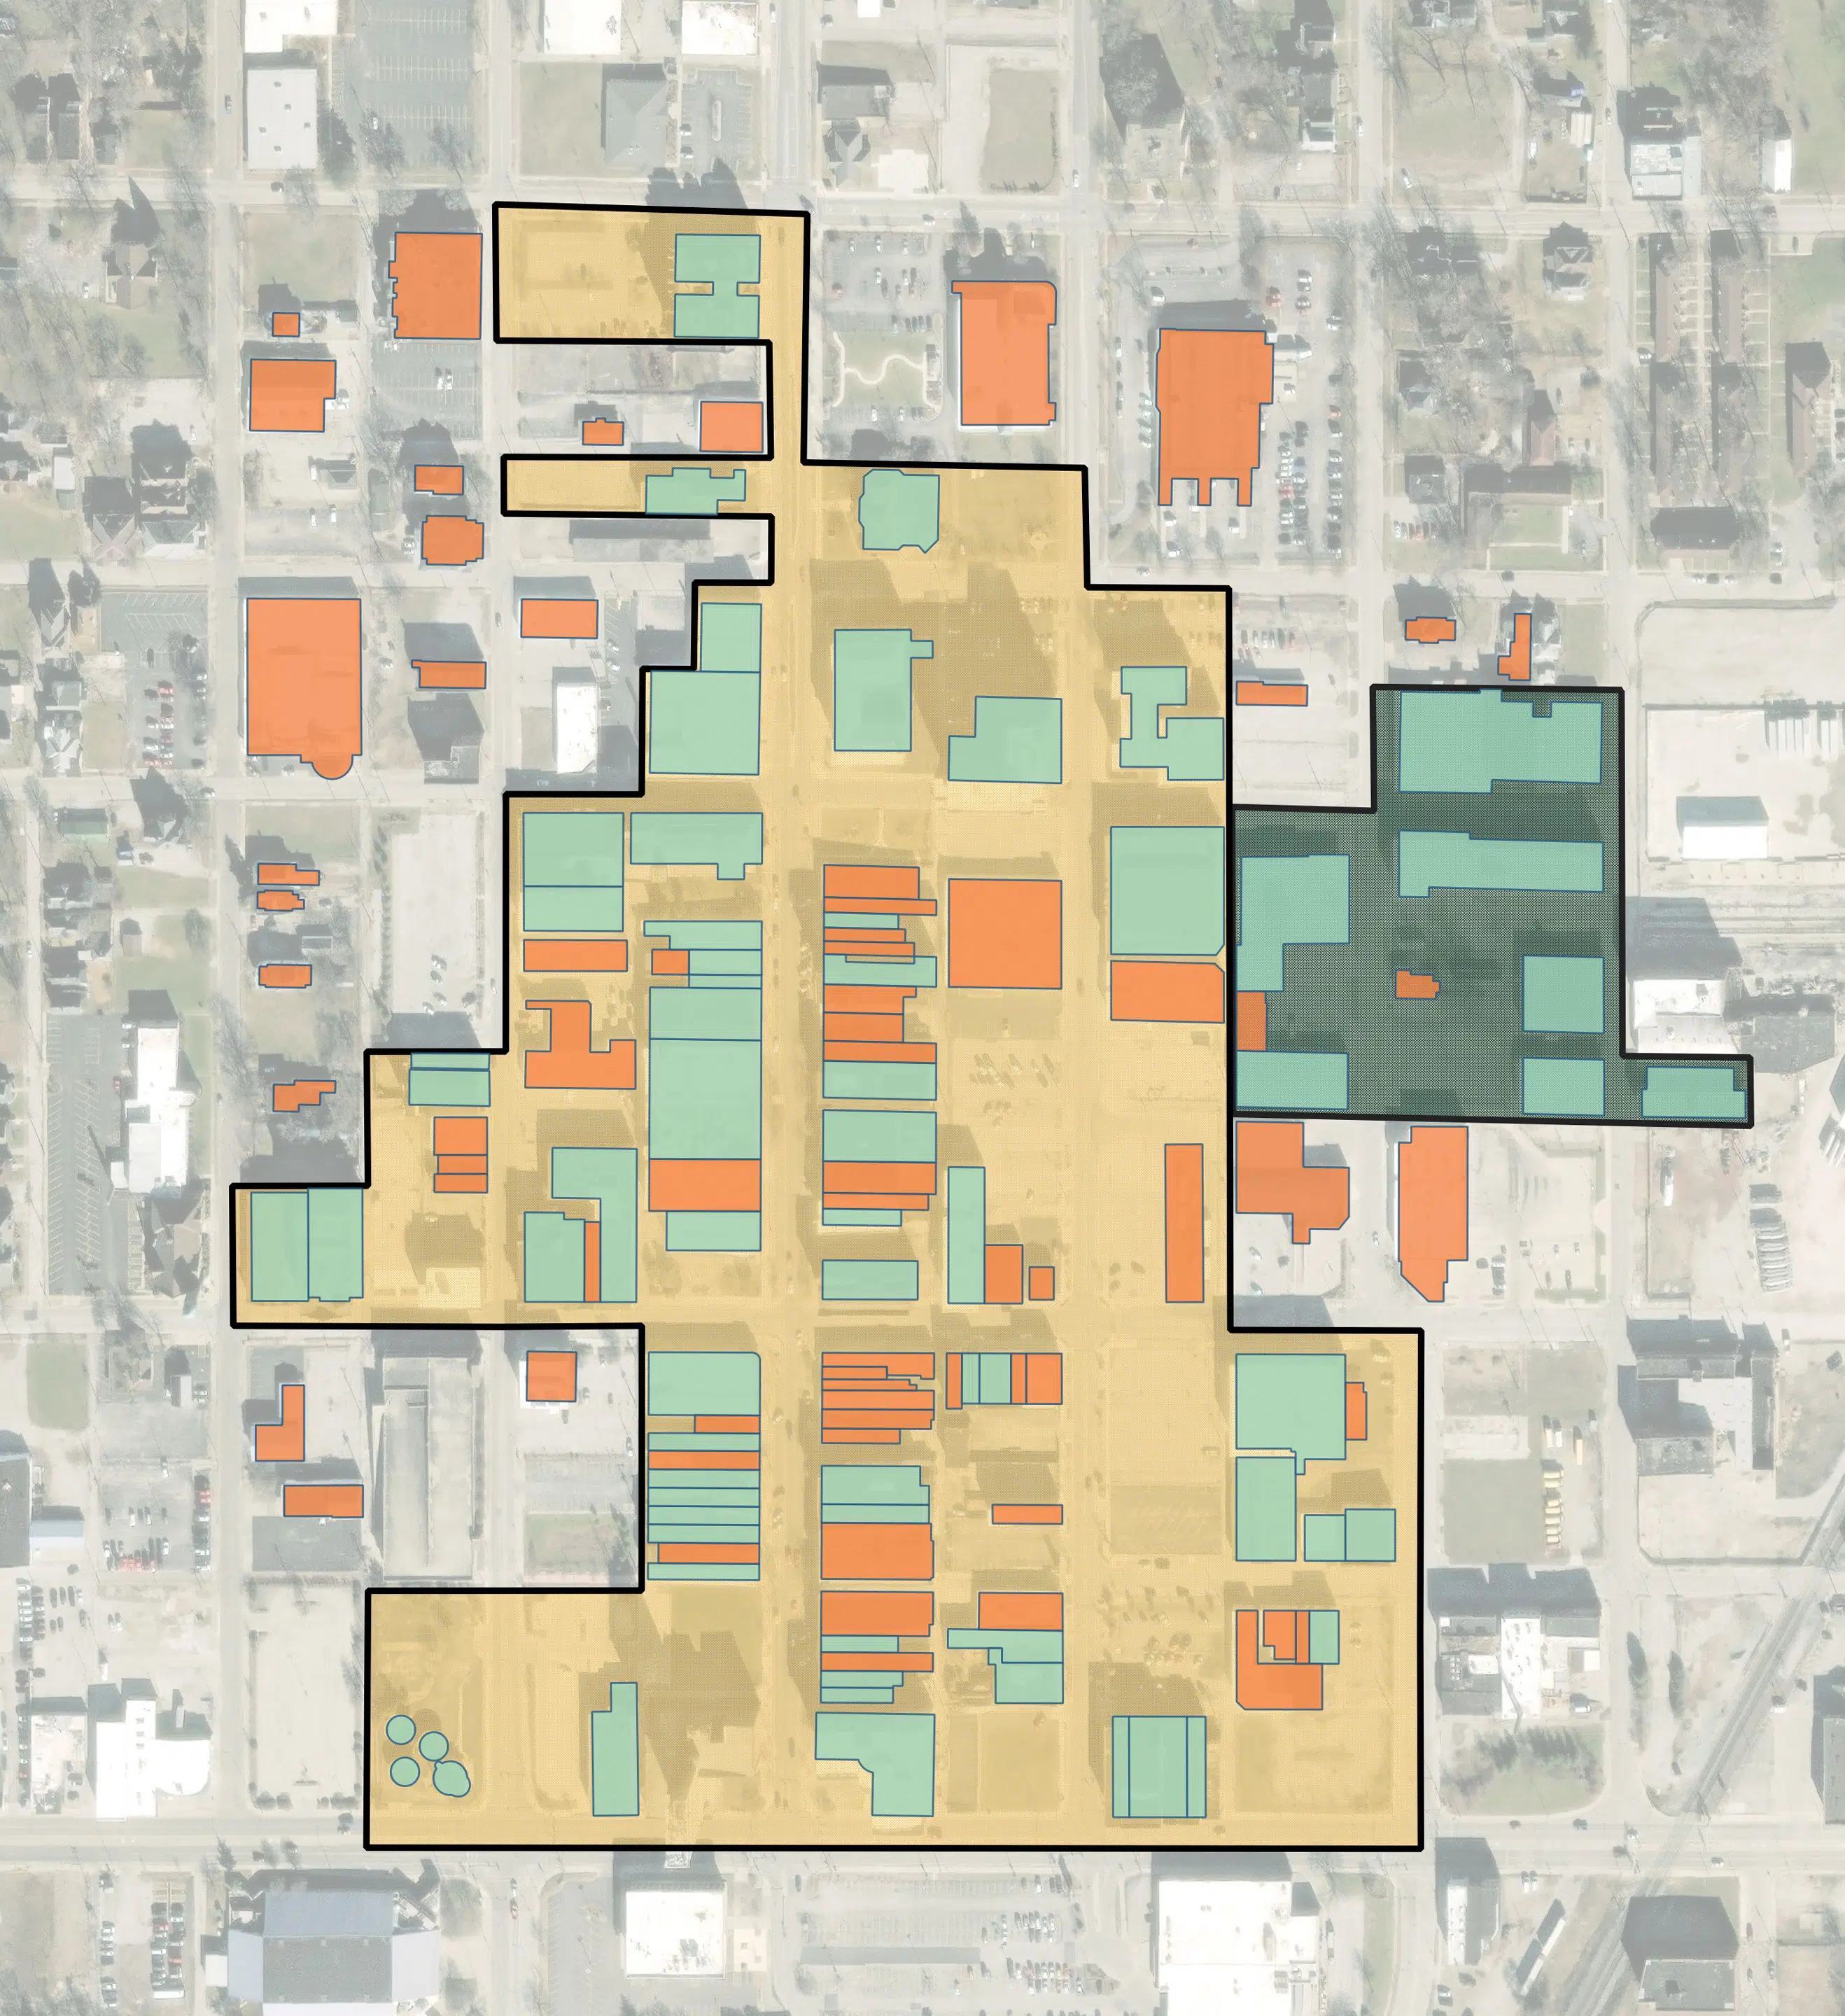
It’s no surprise that we are staunch advocates of state and federal Historic Tax Credits, as they are a critical financial tool that has contributed to thousands of successful renovation projects across the country. To that end, one of our recommendations in the plan was to pursue the nomination of two Historic Districts—a commercial district, and an industrial district—and identified potentially contributing buildings within each district.
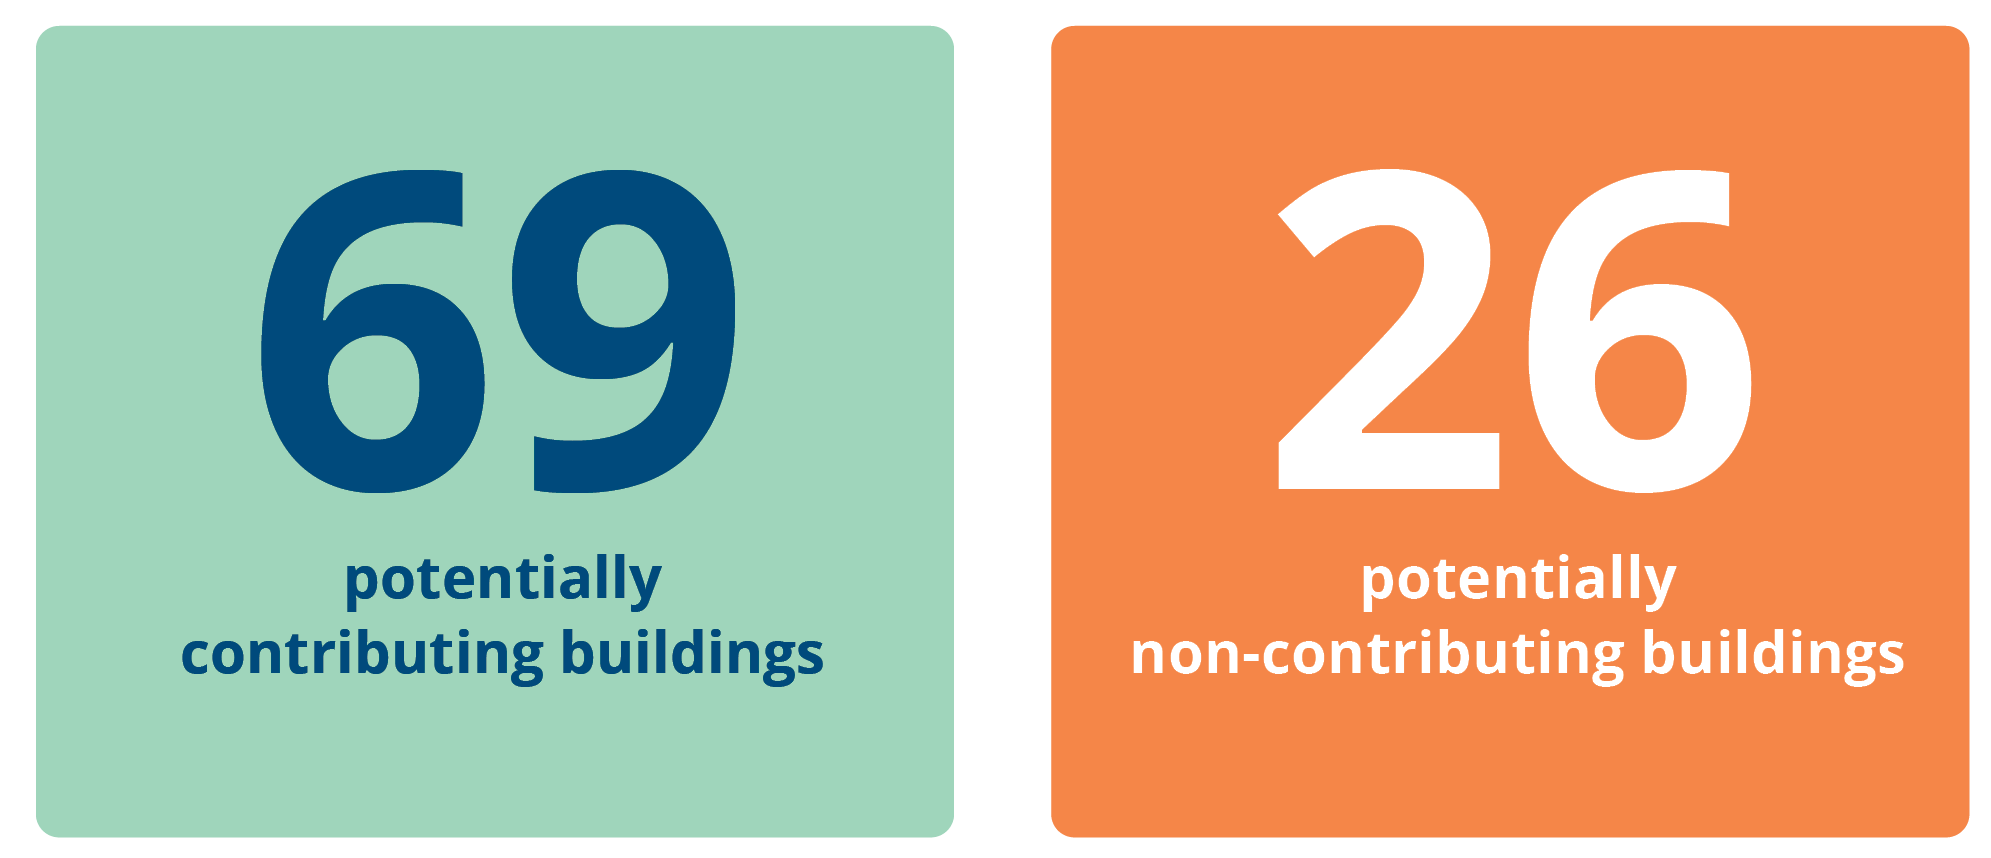
If a building is listed as ‘contributing’, it makes it eligible for the receipt of Historic Tax Credits. Our identification 69 potentially contributing buildings was shaped by reviewing archival images, researching properties in the state’s preservation database, and walking the blocks to view each building.
Analyzing Pedestrian Accessibility
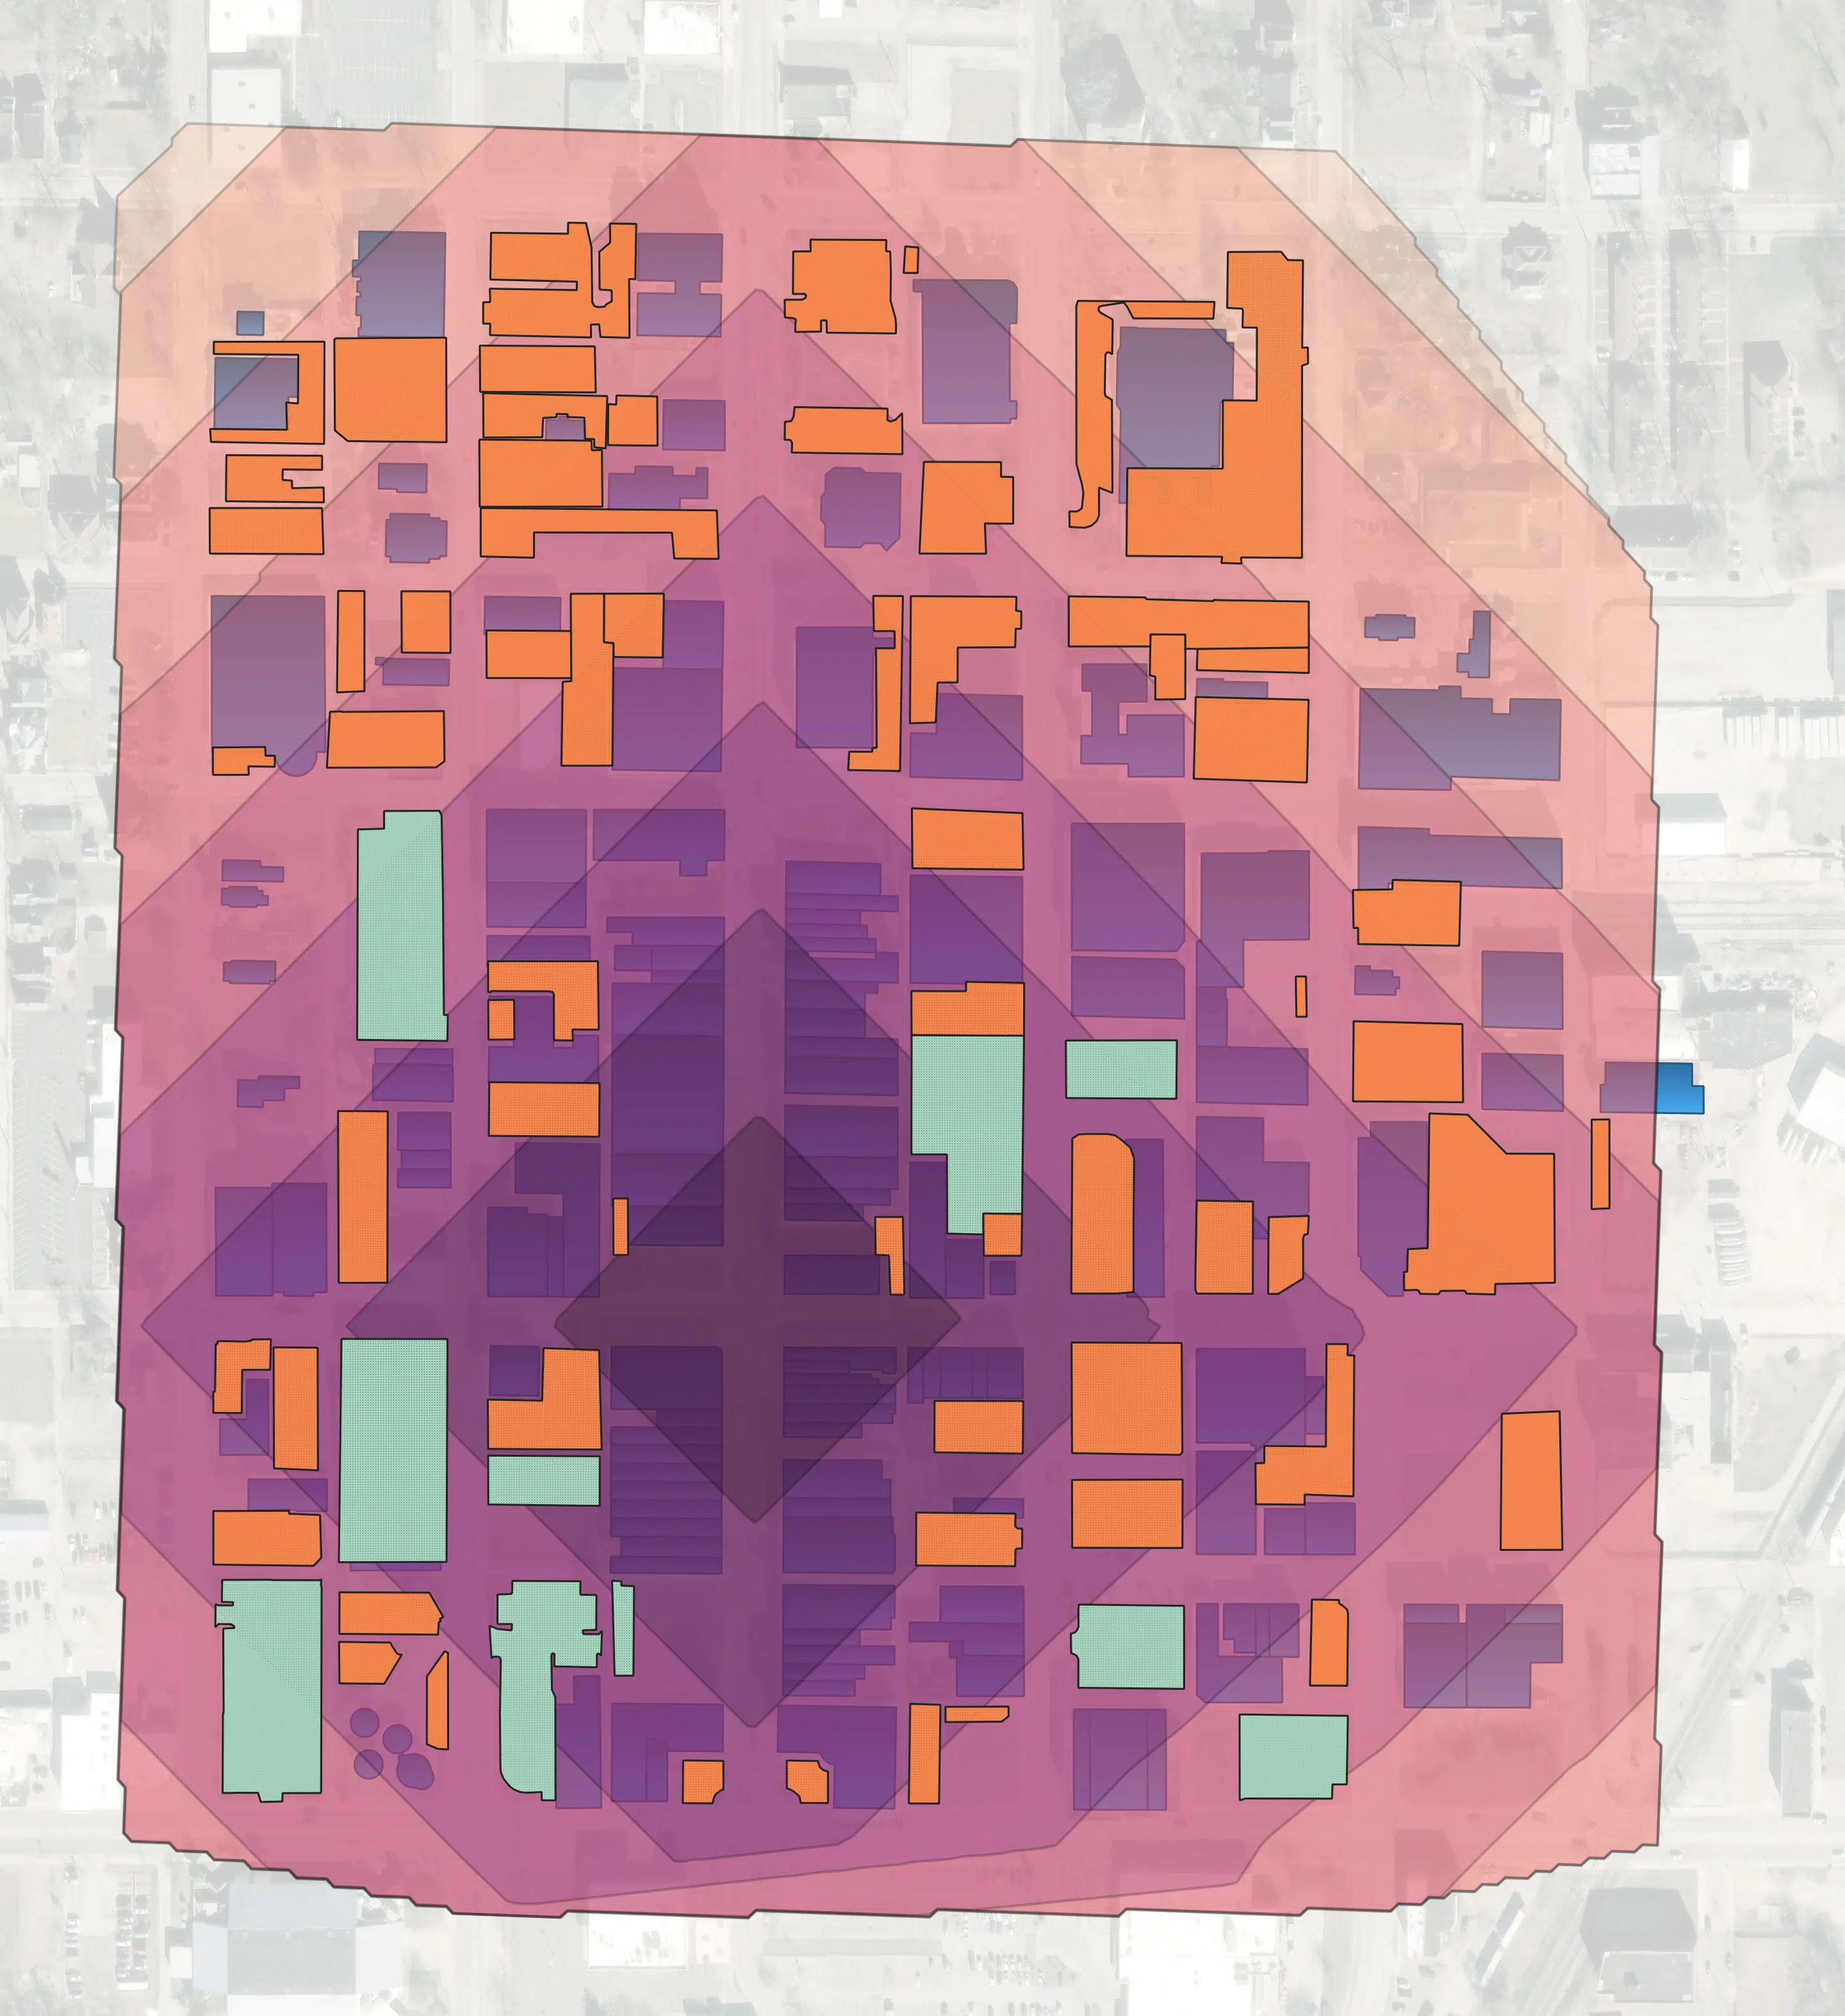
The report also illustrates the accessibility of pedestrians in the study area. Accessibility refers to an individual’s overall ability to reach a given destination, and it’s shaped by a number of factors: Mode of transport, geographic proximity, network connectivity, and much more.
While many folks begin their trip downtown as a motorist, they ultimately become pedestrians at some stage in their journey. So this map illustrates a walk time analysis using the intersection of Vermilion Street and North street as its center.
This map uses the existing street network to estimate how many minutes it would take to walk from this intersection to a given destination in the study area. Each ‘diamond’ represents one minute of walking time (estimated speed of 3.1 miles/hour). This allows the user to clearly see that virtually all destinations including off-street public parking facilities are within a four-minute walk of Vermilion and North.
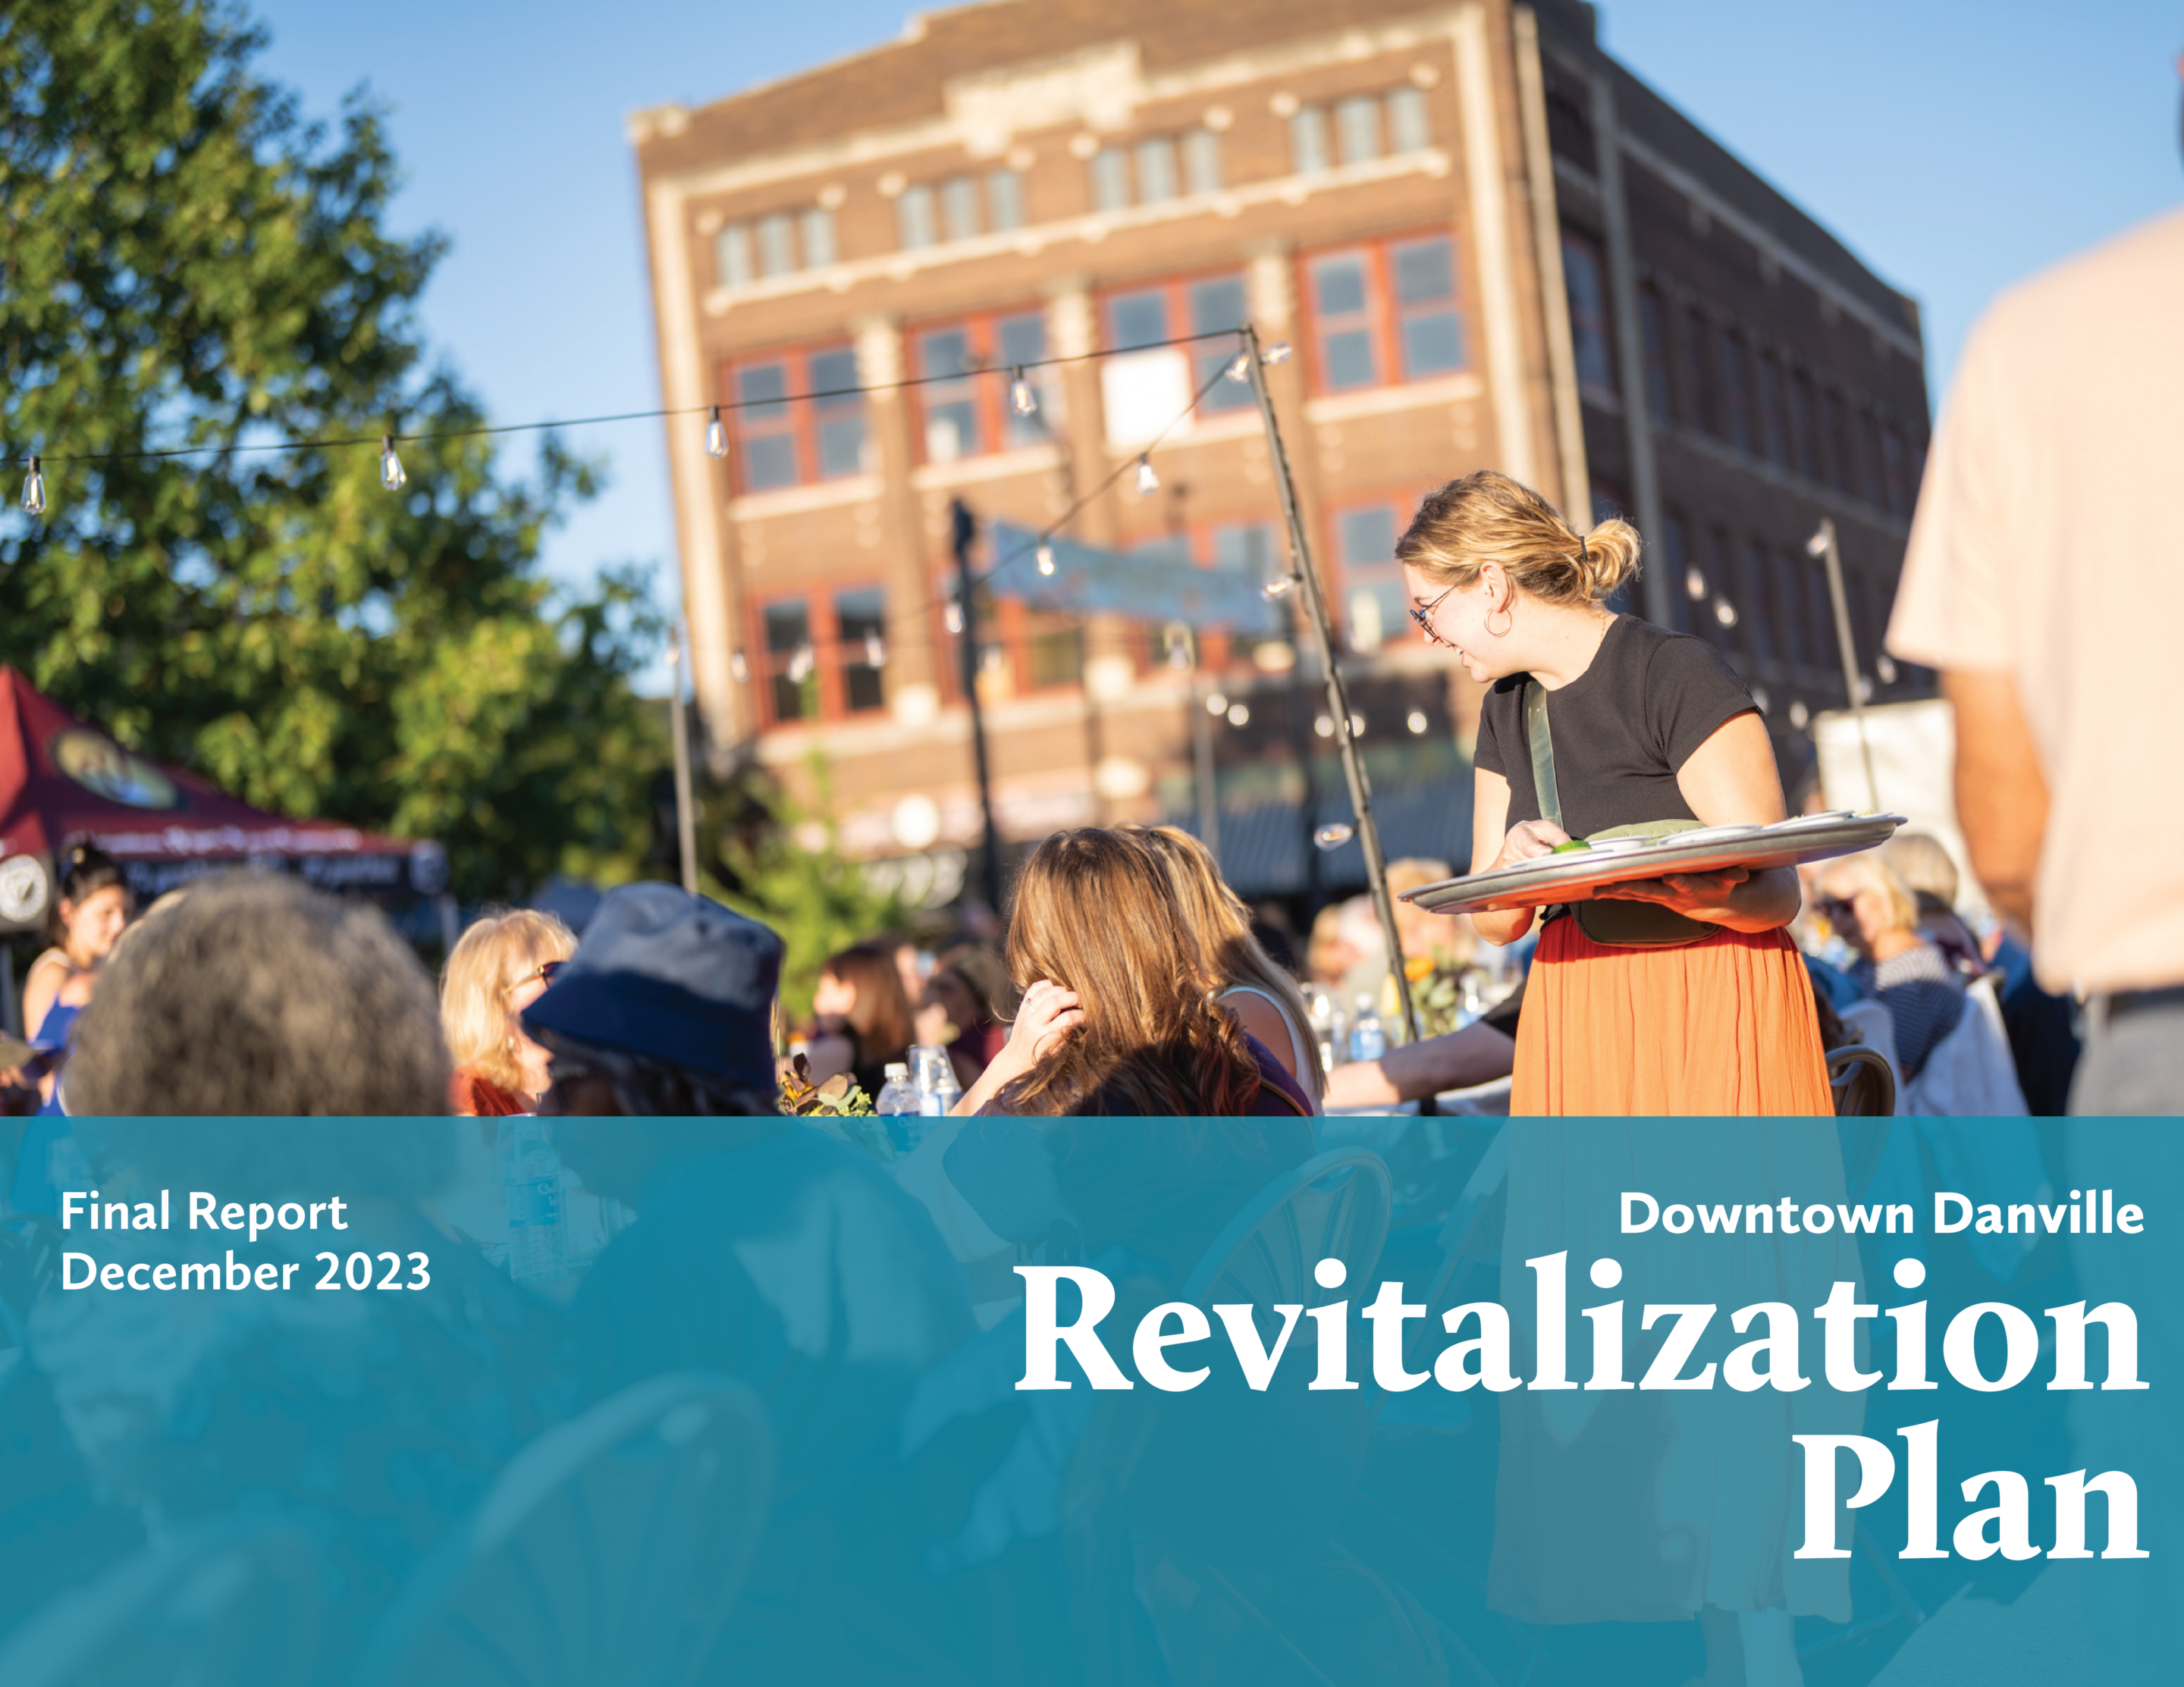
We thoroughly enjoyed working with Logan, Sam, Ashton, Jun, and Mumuchhu with the City of Danville, as well as the many business owners and downtown advocates who helped shape the plan. Learn more about the Downtown Danville Revitalization Plan via its dedicated project page. To read the plan in its entirety, click on the plan cover.
How Can We Assist You in Your Downtown Revitalization Efforts?
From district-wide downtown plans to individual redevelopment projects, our team is adept at tackling a wide range of activities that all contribute to a vibrant, productive downtown environment. If you have a plan or project in the works, reach out – we’d love to help!
Let’s Discuss Your Project!
